Laura Munkholm:
Good morning, everyone. Gosh. Way to port in on time. Welcome, and thank you for being here this morning.
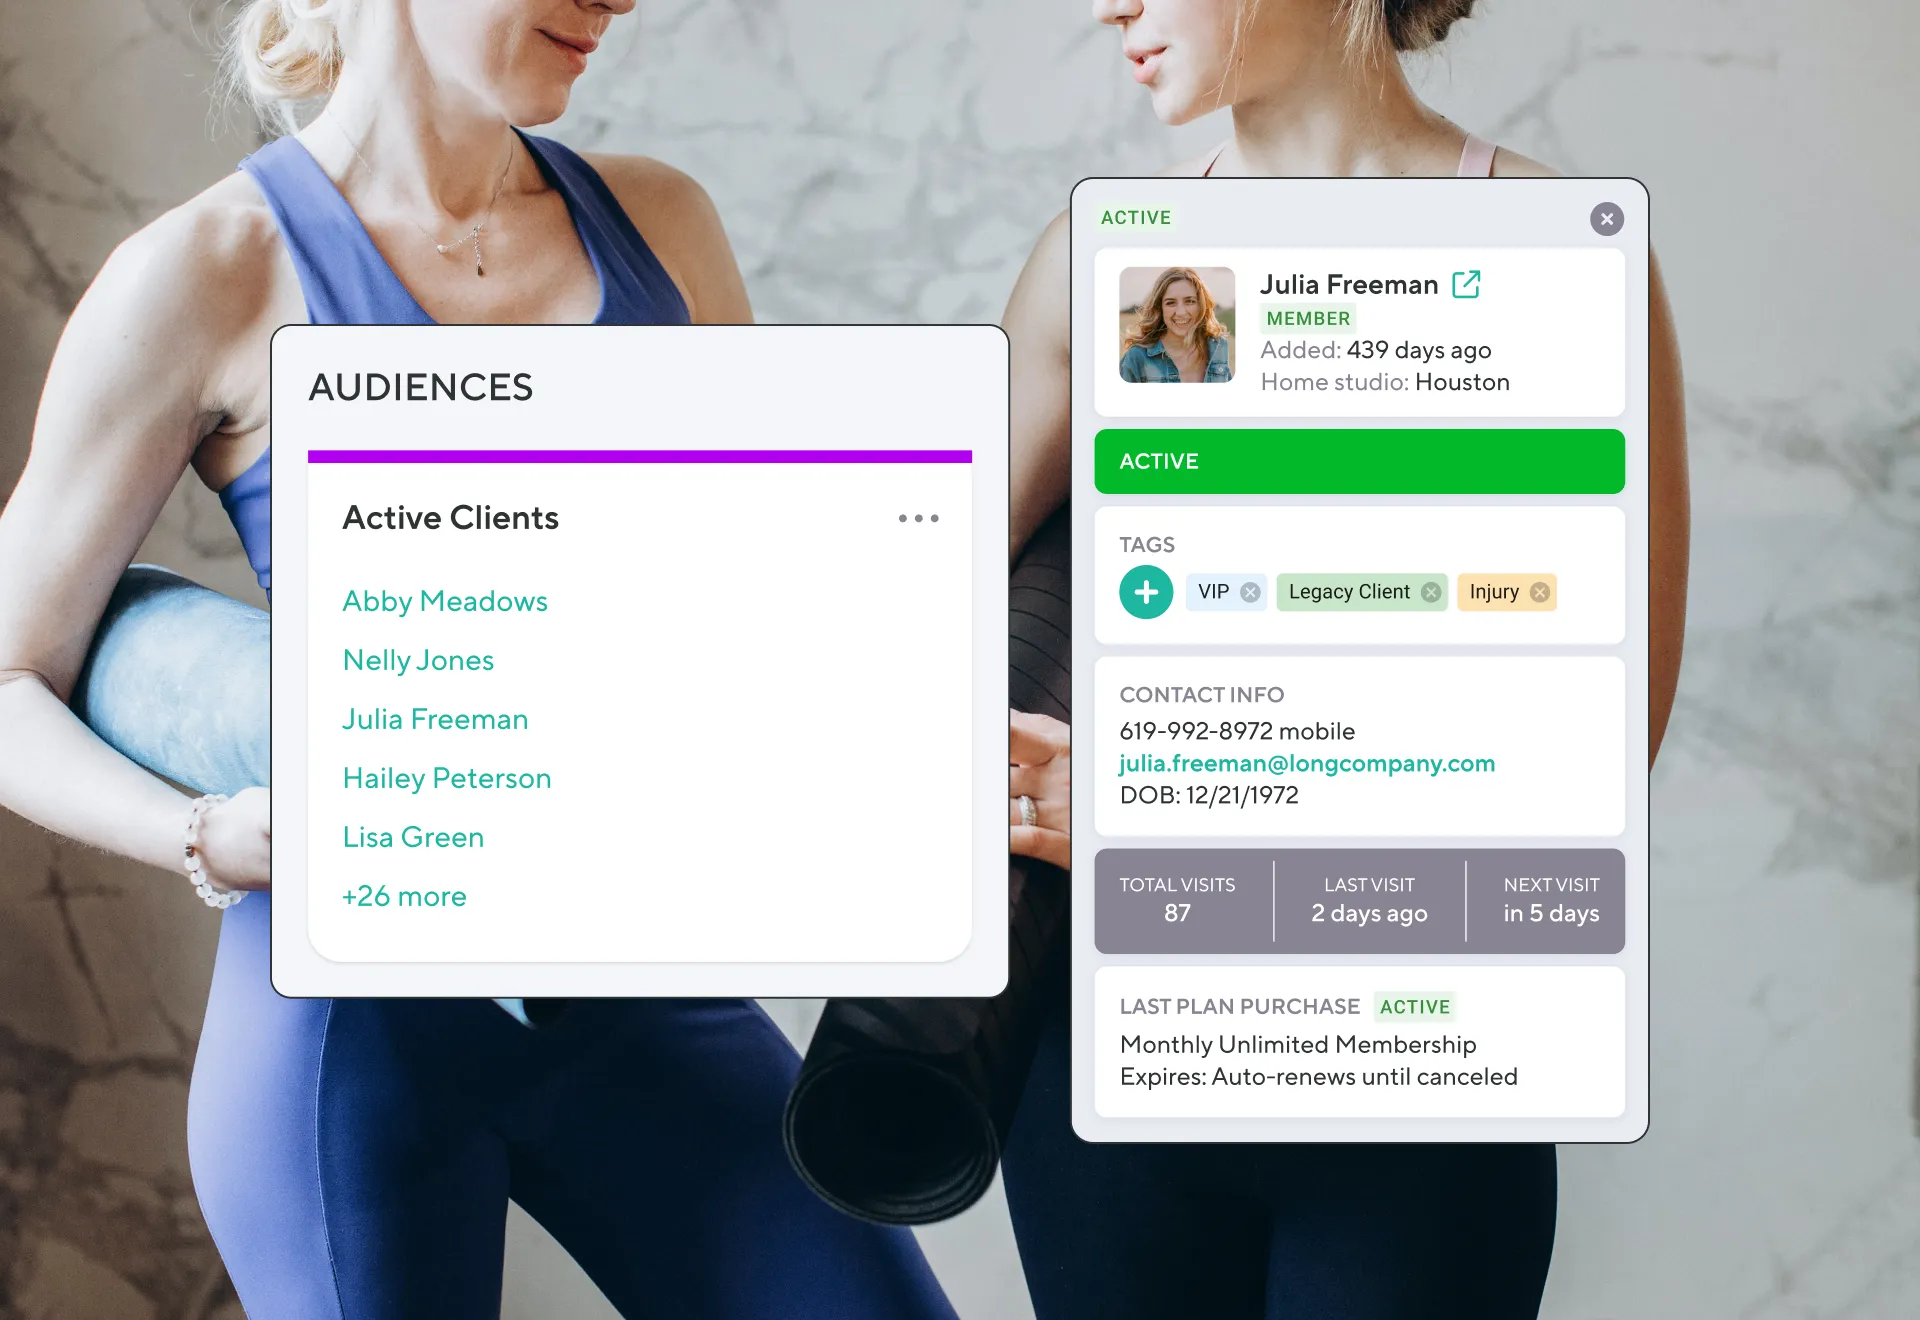
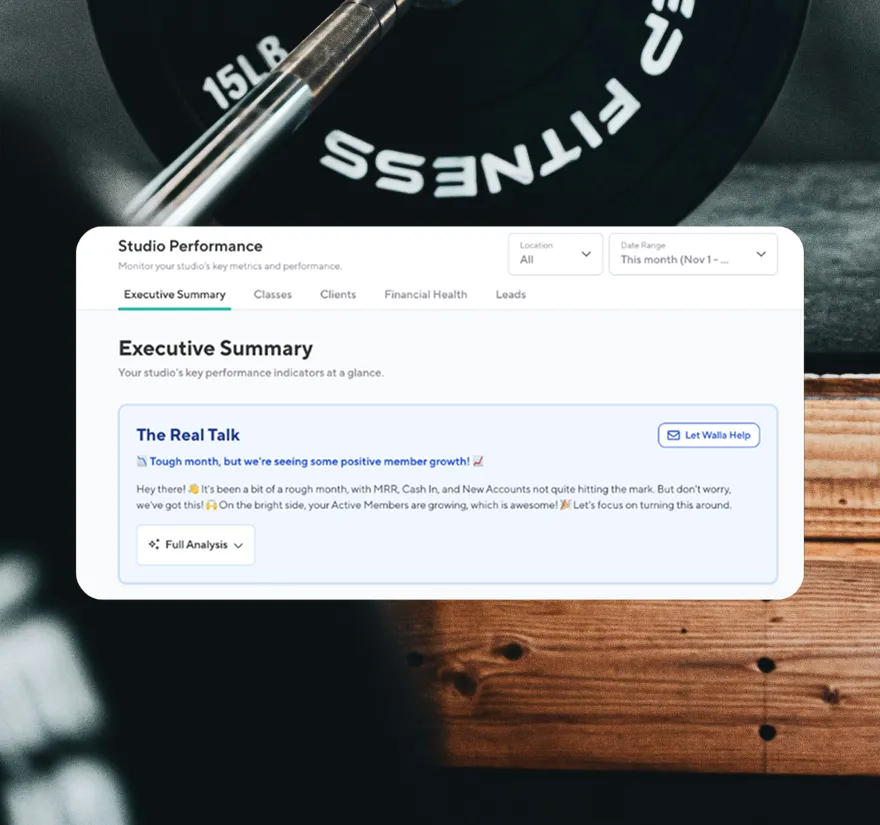
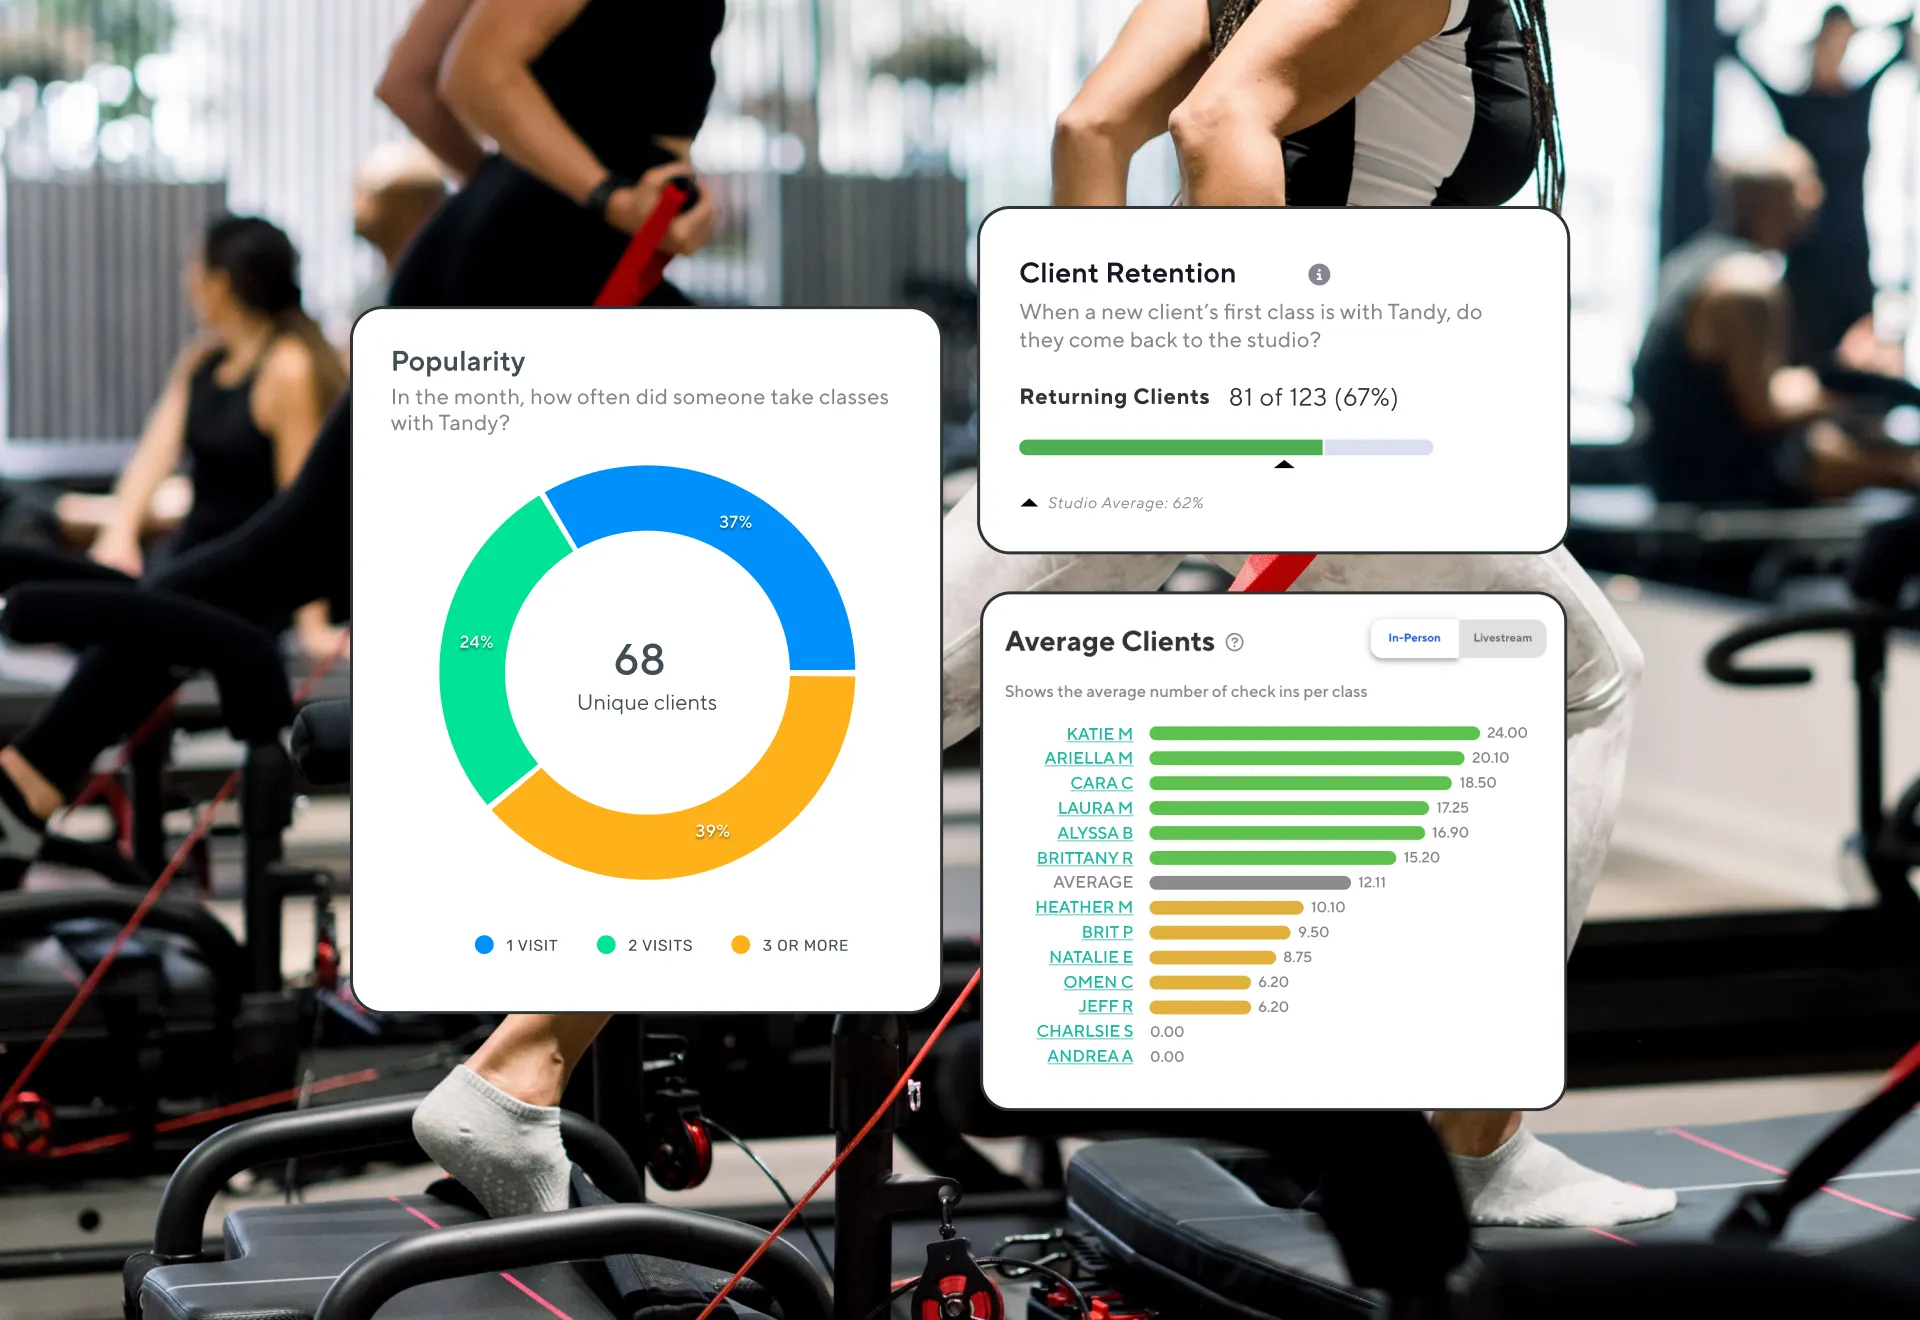
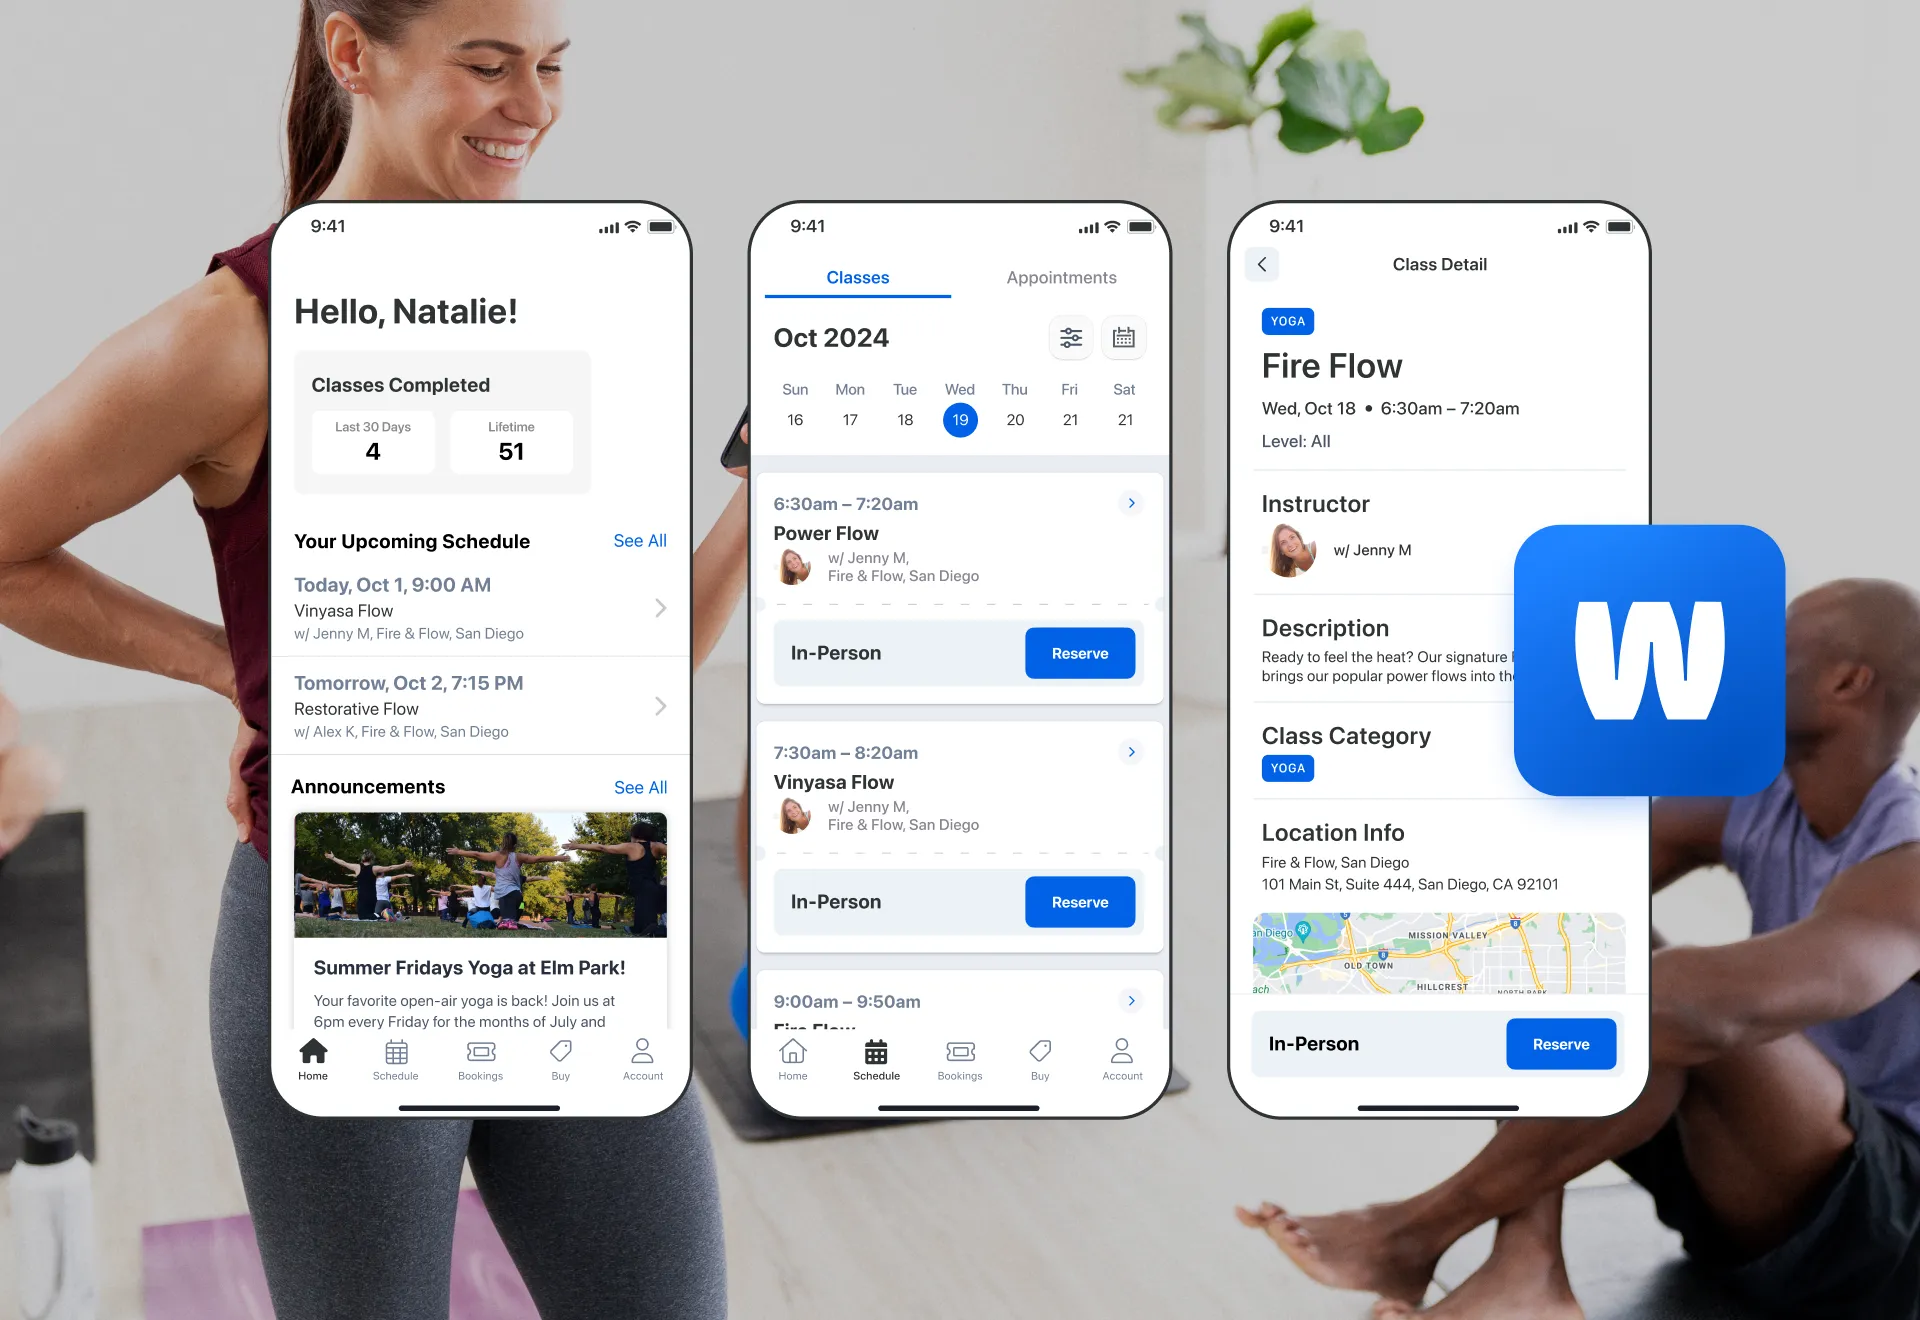
Um we're gonna get going right away. I've got a lot to cover today so thank you for being on time. Um if you wouldn't mind just to get started, hi Hannah, uh pop in, introduce yourself in the chat. Um if you are new to our webinar series this is a little different than Zoom so you're not going to see your face on the screen, um this is webinar format so I'll be sharing my screen most of the time, um but you can still chat on the side and please pop in let us know where you're from, um what kind of studio you've got, and uh why you're excited to be here today. Um my name is Laura Moncomb and I am the president and one of the cofounders here at Walla. And I am very excited to do this webinar because not only do we hear from many of you that reporting is one of the ways Walla stands out, um, but it's something that's ever evolving in our product. And part of that is because of you. We are constantly listening to the questions you have about your client base, about your profitability, uh, about your classes, your appointments, and we want to be able to give you as many answers as possible in a way that's really helpful so you can take action. Um, so I think you'll see as we get going today, um, there are a couple of new things in our product that maybe you haven't seen yet, uh, and also maybe some detail and description on some of the classic reports that you've been using since you got started. Um, hello, everyone. Thanks for introducing yourselves. I will say, um, I we have a whole host of people on this from clients that have been with us since day one to people who are brand new on the software and even some of you who are just checking out Wuala and taking a peek at what we have to offer, but maybe not yet on the platform. So, um, I'll do my best to make this approachable for everyone that's on here. And, um, in the meantime, I've got details at the end if you'd like to follow-up with us after for a deeper dive, uh, demo or have detailed questions. Um, now for those of you that know you're not gonna be able to stay for the whole event, uh, we do send the recording out to everyone who has registered for this. So don't worry. You'll be getting a follow-up email shortly after the event with the recording. And that way, even for those of you that can stay the whole time, you can go back and watch this at any point. Okay. Let me share my screen, and we can get started. Okay. Reporting webinars, share, and slide show. Okay. Um, first things first, I I just wanna tap in here and, a, make sure you guys can all see my screen here, actually, before I get started. Um, Make that a single screen so it's a little bigger for you and great. Alright. Um, our goal with our reporting is not only to help you really propel your studio's growth, so help you grow, be more profitable. Obviously, we're all in this as business owners to make money and make a difference. Um, but we wanna give you actionable data. So you'll see, um, within Wuala, that's that's really something we focused on. And, you know, my guess is that most of you didn't start fitness and wellness businesses to spend hours in spreadsheets. So when we designed our product and designed our reporting, we really tried to make them visually appealing and almost obvious what needs to happen when you take a look at it. So some of our reports are very graph based, some are almost task oriented where you've got a list of things that you need to take care of. But that's what we were going for, and as we've been developing and adding more reports, we've listened to your feedback and adjusted to make sure they're even better as we grow. Now when we think about reporting, so this is something everybody talks about, KPIs, reports, how important they are in studio businesses, uh, in any business really, but it's all about decision making. So I wanted to bucket the reporting in Wuala and just generally reporting that you'd look at as a business owner into a few different areas, um, and what questions we're trying to help you answer with those kind of chunks. So the first is obviously the financial health of the business. And in today's webinar, I'm not gonna spend quite as much time on the sales report and the financial side of the business because those are reports that are typically your go to, your first. I'll I'll dip into them, but, um, you know, it it ends up being something that most people gravitate towards because that is the most critical lifeblood of your business. Um, but there are some questions that you can also answer with some of our reports that might help you with deciding on your pricing or really helping to understand how much you can spend on payroll, for example. Now the other sections are a little bit more about your clients and your staff. So we wanna obviously be monitoring the client base on a regular basis. So we wanna look at your membership, and when I say membership, I'm I'm typically referring to plans that are recurring. So, um, you know, not that I'm disregarding people who purchase a a one time package. Those are certainly important and valuable people to your business. But when we're making decisions based on predictability in the business, I'm I'm really talking about membership as far as recurring revenue. We we also wanna look at the pipeline. So we know as studio businesses that we are always going to have people falling off. Right? We're gonna have clients that churn, people that move, injuries, whatever happens in life, and you need to keep your pipeline strong and to constantly be driving new leads in the door. And what's gonna help you with really, I guess, making the most of that pipeline all the way to when you potentially lose a client is understanding the critical points in the client journey. And if any of you watched, um, my webinar last month when we talked about the game plan for 2025, we spent a lot of time talking about the client journey and really mapping out your own client journey. So I won't go into that today, but if that's interesting to you and something an exercise that you really haven't spent a lot of time doing, I would highly encourage you to just take a creative day and map out your client journey so you can really think about when you want to be measuring and touching base with your clients. Now, lastly, we'll look at the staff and schedule decisions. So you've got decisions all day long with who you hire, which classes you give them to, what appointment availability you're going to offer, um, where to invest your time, your money, and what's actually working for your client base. So those are kind of the buckets we'll we'll live in today as we dive into Wallace reporting. Alright. So today is gonna be quite an interactive, like, in the software experience. So I'm gonna be spending a lot of time navigating within the software and really clicking through reports so you can follow along with me in your software if you'd like. Um, you know, just have maybe two screens side by side so you can click through if you're curious or if you've never seen that report before. Um, but I'll I'll pause from time to time just to pop in here in case there are any questions or confusion on any of those that I'm diving into. So I'll go ahead and share my software screen so we can dive right in there. Um, okay. So I'm gonna be talking through my favorite six or seven reports that maybe aren't, um, you know, the most obvious when you start with Wuala, and I'll I'll talk about the answers we're trying to help you, uh, find and the decisions we're trying to help you make with these reports. So for all of you, um, that are newer to the software or have never seen Walla before, oops, we have a report center. And I often notice when I chat with some of our clients that you don't notice the favorites tab right here. So as we go through this, um, I highly encourage you if you really like a report or if there's something that you're very excited about, make sure as we go into it, there's a little heart right next to each name that you heart that report and make it a favorite. That way, it'll be listed on your favorites here, and then also when you open your daily recap, your favorite reports will be right at the top. Um, first things first on the daily recap, the reason we have this here is because we understand when you pop into your software, it's nice to just look at, like, okay. How did yesterday go? Um, you can see what money is on the way to your bank, what your cash sales were, cash basis sales were yesterday, uh, any new leads that came in or a new client that attended their first classes. Now all of these are clickable. So if I go into that, it's gonna show me the unique first time visitor that came in, um, so you can dive into the details. But generally speaking, we wanna make sure that you've got a a quick snapshot, especially when it comes to money, um, so you can pop in. I was chatting with our bot earlier. Okay. So the first report I'm gonna take you guys into is our plan gain loss report. So this is one of my favorite reports in Walla and partly because of the visual that we offer you, but partly because this really does give you a picture of, um, the health of the business from a predictability standpoint. So I'm gonna look at this over the last twelve months. I kind of like seeing a graph over time. I think it's really telling. For those of you that are multilocation businesses, it's going to default to all locations. So you can always toggle down and look at this location by location. Um, but as we get into the reporting a little later, I'm gonna show you our KPI report that's a really nice way to look at your locations side by side and compare them to each other. Okay. So when we look at this report, it's going to default to all plans that you sell. Now you can look at it this way. In in this case, I really do want to see my recurring plans, and I've designated all of those with member status in my software. Member status in Walla is going to do a couple things. First of all, it lets you select group a group in reporting, so that's really helpful. Um, but member status also does things like give early booking windows or discounts on retail, limit certain plans to members or certain classes or enrollments to members only. But in this case, I am gonna be using that, uh, toggle there. Now you can always look at this specific plan by specific plan, but right now, I'm gonna be selecting just my memberships. And as I go into this, you'll see, obviously, a graph right away. Now you can say, you know, I just wanna see my new folks, or I just wanna see the people who have canceled, um, or I just wanna see the people who have changed. But I'm gonna click on this or hover over this here, and you'll be able to see December. So we tried to put this in as natural language as possible so it was very clear what you're looking at, Um, but you'll see right away that I had a very slight increase from the previous month. So I started the month with 233 plans. During the month, I lost five, so I retained almost everybody. That's fantastic. And I added six, so I did have a net gain. Um, and then the prior month, I had six. I lost six. I added five. So you can kind of go through and check into all of these different data points. Now this is a demo site. I play around with this data all the time, so yours might look slightly different. You might have much more dramatic increases, decreases, um, and, you know, frankly, it's we're not canceling plans all the time. But if I do click into this, you'll be able to see right away, um, who those people are. So maybe I just wanna see my my canceled folks. So I'll uncheck the people that changed, and then now I'll be able to see canceled. So I can see who those three people were, and I can go into their, um, into their profiles and take a peek at what's going on. Maybe they canceled and it just hasn't finished yet or they changed or they canceled that membership and ended up buying something else later on. But either way, this is somebody I kind of wanna take a peek at. I can look at his stats. Yeah. He just hasn't been coming, so this is somebody that I'm not surprised canceled. Right? So, um, you know, as we go into that plan gain loss report, the goal is really to not only give you a big picture view, but then also be able to get as granular as possible. So if there is someone that you want to reach out to or if you see trends happening with certain types of memberships, then you can really dig into those details and look at the the actual attendance history. Okay. So I'll stop sharing that, and, hopefully, for those of you that are, um, in Walla now using Walla consistently, that's a report that you lean on. And and really here, we wanna just give you a nice snapshot of how that recurring member base is going. And also, again, you can use that for any other plans. Like, if you wanna see how many, if you have growth in a certain plan's purchases, um, like a 10 pack or you're trying out an eight pack one month or over a few months, you can really see the growth or decline of that there. Okay. So the next report I'm gonna go into is one that I I often find clients are surprised by or haven't checked out yet. So that's why I wanted to give you guys a nice clear walk through. We're gonna be popping into the plan retention report. So the goal of this report is to look at a specific plan type. So maybe it's gonna be my monthly unlimited membership or my top tier recurring membership. And I want to understand, you know, roughly how many months we're able to keep people active on that plan from the start date. So I'm gonna select a plan here, and I have probably my most common plan in my demo site is my monthly unlimited membership. So as soon as I select that, it's going to give me my annual churn rate and my lifetime value. I can only hope some of you have crazy lifetime value like that. We've played around with pricing on this and made it cost a thousand dollars or $5,000, but you'll probably see a much smaller than number than that, so don't be alarmed if it doesn't look like $25,000. Okay. So what I want to call your attention to here is kind of this waterfall style graph. So you can see in January 22 is when I started selling this membership. And at that point, I sold 17. So where we are now, I'm a month 37, I still have 41% of the folks that purchased that membership in January 22 active on the plan. So you can see here as we go, the color starts changing. So when it's dark blue, that means you've got a high number. Once it gets to 65% and below actually, 70%, I believe, and below, it starts getting a little lighter and then lighter as you go. So the the thing to call attention to is if you see a dramatic change consistently, like, if you look down this column and you see that month three, month four, month two, month eight, whatever it is, you start to see a trend of when there is churn, when there are a lot of people canceling. Um, that tells you from, you know, thinking about decisions to make in the business, that's a great time to double down on your nurture efforts with your clients. So perhaps if, you know, month four is when you see a pretty significant dip in in, you know, active members on that plan, um, month three might be where you double down on education about the benefits of certain classes or, um, you know, really encourage people who have only gone to one class at the studio to try a different style of class. So there are all kinds of retention strategies, and we've got webinars that go into different styles of retention, um, but it it really can be helpful to engage those when you know there's a point when membership really starts to dip off. Now the other thing here is that when you see the lifetime value of these folks, it's gonna help you make decisions on how much you invest in trying to attract those people to your business. So, for example, if you know getting a monthly unlimited member or maybe I'm gonna look at this as an eight times a month member as well, um, because I've got quite a few people on that membership, um, I know once I sell somebody on this, I'm gonna make a lot of money. So it is well worth it for me to invest in marketing this specific membership or perhaps even paying a staff member to sell these memberships. Right? So that's the goal with the lifetime value is to help you understand, okay, it's really worth it for me to invest heavily on the front end because this is what I'm gonna make once we have that conversion. And then you can really start to play with goals for conversion rates, but we wanna arm you with that information so you can decide how much to spend. Now as we go down into this report, this is where you're gonna get to the details. You can see I've got both of the different memberships here because I've selected monthly unlimited and the eight times a month membership, but, um, you can see the the January cohort. So you can get into the details. You can see who's canceled, who's still active, and, again, you can click on any of these, and you can go in and, um, take a look at their their visit history and what happened. Maybe there's a, you know, maybe there's a really consistent trend that once somebody dips under x number of classes a month, they're probably gonna cancel a certain membership. So, again, you can choose how deep you want to go into the data, but the opportunity is here because we offer you all of the individuals and the ability to go into their specific profiles. Okay. I'll stop sharing here because I know that's a report that not a ton of people use on a a daily basis or at least that I've spoken with. So, hopefully, that's helpful for you all. Um, just show of hands or thumbs up. Has anybody in here used that report regularly or to make decisions in their business at this point? Yep. Awesome. Thank you. Yeah. I think this is gonna be one that once you start, um, playing around with it and looking at the value of the different memberships, it's really gonna be telling, um, you know, what's worth it to invest in in the business. And maybe you'll find that certain memberships really don't have much of lifetime value, and it doesn't make sense to have them on your price list. Okay. Next report. Um, uh, yeah. It does need twelve months of data for the lifetime value, and sorry. Thank you for saying that, Ashley. For the lifetime value and the annual churn, you do need twelve months worth of data in there. So you'll still be able to see, um, when you sell them and if there is a month that they're churning in. Um, you don't need twelve months of data just to see the waterfall version of that report, but you won't get the lifetime value and the churn until you have twelve months. Okay. Let me go back into the software here, and the next report we're going to be diving into is our first visit report. Now this is typically a report that, um, a lot of people are used to using in other software when they migrate over. Those of you who are brand new to being business owners, I highly encourage you to use this report on a regular basis, not only because you wanna see all of the new people in, you know, visiting your business, but you also want to see this critical stat at the top. So I'm actually gonna go into a custom period, and I'm gonna go to last year and look at over a year period. So first visits over the last year in my demo site here, I had a 116 unique first time visitors. Um, 45% of them came back for at least one more class. So when I would do coaching with businesses prior to starting Walla, we always had a goal of at least 50% coming back in. So this is a step that this business could be working on. Right? I often see with businesses that have studios that have very difficult workouts, so very physically strenuous workouts, that number can be a little bit lower. Um, and also businesses that offer a first class free, that that number can end up skewing a little bit lower. So every business has a a bit of a unique experience, but I would say shooting for that 50% number is really gonna be helpful, um, as far as keeping your your pipeline strong and kind of filling in those memberships that you might lose over time. Now one of the nice things about this report that I like is that you can toggle, um, the lifetime visits. So you can see, uh, if there's anybody who came in a ton of times, if there are people that, um, only came once, you can check those boxes and you can actually message people directly from this report. So if you do have people, you know, let's say it was over last week or a couple weeks and you wanted to reach out to those people, um, and send them kind of a personal message. Maybe I do last month. Um, and I wanna see the people that only came in once. I can always check their names and send them a message saying, hey. You know, it was so great to have you in the studio. We would absolutely love to have you back for another class. Um, if it was a month ago, maybe you offer them an extended or intro offer, uh, or you give them a comp class to come back in. But anything that might be, um, helpful to get them to remember. And, also, it's a great time to ask for feedback. So there's a good chance a lot of the people that are in here that only came that one time actually didn't have a good experience and maybe didn't like the offering or had a bad time with the teacher. So don't be shy. I think oftentimes we always want to hear the good. Obviously, that's natural, but you're gonna learn a lot as a business owner hearing, especially on a one to one basis, personally, from someone who who didn't have a great experience, and and you're gonna get better as a result. So that's the first visits report. This one is pretty straightforward. I just wanted to make sure everybody was looking at this. Um, this is also a great opportunity to look at anybody who, uh, only purchased a drop in. So if you look at this, you can, um, toggle to whoever purchased a drop in specifically. I don't think I had any. But if you do, those are great opportunities to reach out and say, hey. You know, I know you purchased a drop in. We have this amazing new student special. I would be happy to extend it to you, and, you know, here's a link to purchase that. And you can create a non intro offer version of a a plan to sell to them specifically. Um, I know many of you that have the sales and marketing center probably have that automation already built. We can see here that's that's a very common one. So first visit drop in, upselling them into a membership. Um, but if you don't have the sales and marketing center, the first visit report is a great place to go to actually see those people and manually send them a message to encourage them to come back. Um, okay. Any questions there or anything that you've been curious about in that report? Okay. Great. Uh, I will pop into our next report, which is kind of the the follow-up to the first visit report, and this falls under that, you know, monitoring the client journey experience, and that's gonna be our intro offer report. So the intro offer reports, I will highlight right away, is only gonna be for businesses that built their new student special as an intro offer in Wallace. So that is a specific type of plan. And when we go under plans and head to intro offers, I'm gonna go in and see I'm gonna apply my my yep. I'll compare the two because I've got quite a few. I'll look at the last six months so we can see a good chunk of data. Um, but in this case, I've got two intro offers I ran over six months. So I kinda wanna see them compared to each other. Now the first thing to know is that this right at the top, whenever you see a little fire or a a tile at the top of a report, we call that our action cards. And action cards typically are going to take you to a list of clients or a grouping of people that need action taken. So when I click on this, this is going to show me everybody who has expired in the last twenty to sixty days, nineteen or fewer days ago, and then the people who are still active on the intro offer. Now the reason this is so helpful, especially if you have a front desk staff team or a sales team, um, that's gonna be reaching out to folks during their new student special period, uh, you can see here in one glimpse how many visits they've had and if they are opted into marketing. Because even if you have the basic the core tier of Wuala, you still have the option to use our, um, prebuilt journeys. And we have a a really relatively robust intro offer nurture journey here, but that's only gonna go out to people who are opted into your marketing. So you are gonna be able to see right away if somebody is not in marketing. Um, they're not getting any of your communication. So you might have somebody that came eight times, but they've never gotten an email from you nudging them to purchase the the intro offer, or maybe they didn't come to classes where there was a front desk staff to chat with them about it. So this is a great opportunity to, you know, take a look at this with a snapshot, and then if there's somebody who never came in and they expired, perhaps emailing them and saying, hey. I'm gonna extend this for you. Um, we'll give you another week. Or Davante Adams here, while he's not playing in the NFL, was coming to three classes at my studio. Um, but you can see that he came three times. His last visit was forty one days ago. Um, but I can pop into his profile, and I can see who are the teachers that he went to. Um, he did take a number of different you know, three different classes when he came in, um, but he's a great example of somebody that I should just send a quick message to and say, hey, you know, it was great having you in the studio, and it looks like you got to try a few of our classes. Now what what can we do to get you back in, or is there anything that was missing for you? So this is hopefully going to be helpful in giving some context to those sales conversations. And, uh, I don't know. I'll I'll stop sharing for a minute because I think this is this is a helpful thing just for businesses that are really sales oriented. We're all looking for ways to have a little less awkward of a conversation or a a sales conversation that feels like it's not pushy or selling, that it truly is genuine care and maybe education oriented. And whenever you have this information, it's not just a scripted, like, hey. We miss you. Um, those of you who have been on webinars with me before, I have a really, it's it hits a nerve when I get we miss you emails from studios because most of them have the exact same language. They say the exact same thing. I know they're an auto email, and it just, uh, it doesn't feel genuine. So these are opportunities when we're giving you the list of clients when we've got the stats and the data in their, um, profiles. So you can reach out to them and have a a really helpful conversation, and you've got something to talk about rather than just a a scripted automated line. Um, so that is the the action part of the intro offer report. Now when we go back in there, um, I'm gonna show you where you can kind of set your goals. So when we go back into the intro offer reports, and I I'm gonna select both of mine that I'm using right now and the last six months. So first of all, if you are if you're a business that has multiple intro offers, this is a great way to compare and contrast. So you can see here my first class free, I didn't sell any. My one month for 39, I sold a ton. So this is gonna be an easy one to compare and contrast. Um, you will be able to track the conversion rates of the different intro offers and see which one is more effective. You may sell way more of one intro offer. Like, if you have a first class free, you'll probably have tons of those, but you may not make much money on the conversions. And then you might look and say, okay. Well, we also had a one month for 99 or 39, and I ended up making $8,900 on those conversions. I sold way fewer of them, but this is a great way, especially as you're going into the new year. For those of you that are expanding studios, going into new markets, the great thing about intro offers is you can test because it's not gonna affect your existing clients. You can constantly, you know, every few months be, if if you see one not giving you the results you want, you can test another one against it, whether it's with a meta ad or, um, sending emails out to an audience of folks who have given you their information but never purchased something. So that's all here. You can see your conversion rate here. You can see what they converted to, and then you can see the monthly recurring gain and the total revenue gain from that intro offer. So goal is really to make sure that you've got educated decisions and that, um, you know, if if you're trying to decide which intro offer is best for your business, you'll be able to see what's what's clearly making you more money and driving more people down the funnel rather than just kind of the vanity metric of, oh my gosh. We had tons of people in class today. Um, I I often find that busy in studios um, doesn't tell the whole story, especially if you have a very inexpensive intro offer or you're leaning on something like ClassPass. Um, I'll pause there just to see if there are any questions on the intro offer reports. I, um, I know that's a really common commonly used report, but, uh, hopefully, that eliminated some things about it. Okay. Awesome. The next couple I'm gonna go into are about your classes, um, and I'm gonna preempt this by saying some of the data specifically on the class analysis report, if you are a heavy well hub or ClassPass user, Um, it won't be quite as relevant to you because we essentially assign $0 to ClassPass visits. We don't have the the financial data from ClassPass, so we don't have a way of giving you accurate financials on those folks. Um, but if you're not heavy ClassPass or WellHub, um, these can be really helpful reports for you. So let's go back into our report center, and under classes, you're gonna find class analysis. Um, now class analysis is one that from a decision making perspective, I find to be really helpful, especially when you're trying to look at setting goals for attendance for your staff members, um, and and really deciding what types of classes to put on your schedule, um, what teachers to put on your schedule more. The if you are a business that has all the same classes, if you're a Liguire studio that has one type of Liguire class all day long, you're really not gonna need to play around with these, um, class types much. But you will probably want to look at the staff members and see who's doing, you know, what and how profitable they are. But the the goal here really is to give you a big picture of how many people you've got coming in, really what they equal in revenue to you. So every time somebody comes to your studio actually, let's look at this over a broader period of time. Um, again, this is a demo site, so I'm not checking people into it every day. That's why the revenue per class and per visit look a little funny. But this is going to help you set goals. So if you know, for example, that most of your teachers are making $40 a class or 30 or 60, whatever it is that you're paying them, you know that your revenue per visit or revenue per class is x or y. So you've got to set goals for yourself. You may find that you frankly can't afford to pay your teachers $60 a class or 50 or 40, And when you look at it by teacher, you'll be able to see profitability very quickly because we pull in the payroll information for them. Now one thing I'll call out in all of our reports, anytime you see a little I or a little question mark, you will click on it. You will learn a lot. Um, this is where you can see, uh, the formula we use essentially for getting to that number. So total revenue, you can see, is quite long, but that's really because of the unlimited plans. Um, we often get the question on this, how are you assigning revenue for an unlimited visit? So when we say, okay. Great. Revenue per visit is $22 or revenue per class is, um, a $150. That can vary because you have people with unlimited plans, and some people come one time a month, some people come 25 times a month. That's why we had to essentially build a formula for that. So we essentially start by determining the number of visits per month, and we confirm that that specific plan, so let's say your monthly unlimited, has been in existence for at least sixty days. So if you're a brand new studio, if you just came to Walla, and it hasn't been in existence for sixty days, we're using a divisor of five. So that's the average that we see across all businesses. Um, if the plan is older than sixty days, we now create a segment of clients who have owned an active version of that plan when the class when they took the class and own the plan for at least thirty days prior. And then we look at the average number of visits for all clients in that segment. So we're trying to give you essentially a number that that you can work with so that you're not being skewed having somebody's visit be worth, you know, $200 and somebody else's visit be worth $8. So we're looking at an average across the board. And then that's how we come to these revenue per class, revenue per visits, and total revenue numbers for those classes. I know that was a lot of kind of math, but we we needed a a single divisor to make this usable data and to really help you make decisions. Um, okay. So this report, I think, is really helpful to look at when you're analyzing teachers' pay, when you're analyzing what classes to put on your schedule, and also in general when you're looking at if there are, you know, specific classes that are losing you money consistently. So you can either export or look through here. I mean, again, this is a demo site, and they're all negative because I'm not checking a lot of people into class. But if you're consistently losing money, it's really nice to click in and kind of check it out. Or if you've got high earners. So if I go into my this all levels Hatha class, anytime you click on these, it's gonna give you an opportunity to look at the class analysis. And here, if you've, again, never looked at this, you can view the detail, and it's go going to show you what each individual is worth in that class, how much money they were worth to the studio. We use that same formula. As you can see here at the Fire and Flow Unlimited, $40 $40 because we have a different, um, divisor than the monthly unlimited, different group of people. That one was $37. So this is, uh, pretty straightforward, but helps give visibility into, um, what each individual is worth. Okay. I'll pause here. So filtering by payment method in the first visit report, you can, um, toggle that. So you can chunk them out. Like, you can see them alphabetically then either one or the other, and you can do it in the export. So that's the that's what's possible right now. But if you've got feature requests on report, please just make sure you email them to support at hello walla, and you can just put feature request in the title. Okay. To be able to group or filter this class by daytime. Yeah. I know that is, um, a pretty common, uh, request, and our team has been working on it. It's something we're we've talked about. So, uh, again, if you've never requested it, please do. The more we get specific requests, the more that moves things into our our, um, roadmap. So and keep an eye on the product portal in the software because you'll be able to see what's planned and what's under construction. Alright. Uh, last couple of reports here I wanted to go into. Um, for those of you that are appointment based or have more appointments in your business, um, kind the complimentary report to the class analysis report is gonna be your appointment revenue report. So if I look at the last sixty days, this is where I'm gonna be able to see my revenue for those. And, essentially, this is kind of a combination being able to see those first appointments, um, the number of appointments total, and then also be able to look at, um, you know, generally speaking, your your teachers. You can look at this by staff who's who's generating more revenue and what appointment types are generating more revenue. So those filters will help you get an understanding of where you're most, um, likely to have attention on your schedule for appointments. Okay. Couple more. Um, class attendance is a really fun one. Um, this is something that I I often tell clients not to just scroll through quickly because you actually can learn a lot from this report. Um, first things first, I know if you're looking at this on your phone, you actually have to click on the bar. But on screen, when you hover over, you'll be able to see your utilization rate there, like, checked in utilization rates, um, your capacity. You can also group this. Like, if you're looking at, um, last week, for example, you can group no. Hold on. Let me look at last month. You can group it by weeks or days. So some people wanna see this. Just make sure you look at the grouping because sometimes people ask, like, oh, I just wanna see this by week or I just wanna see this by day. So you can do that there. Um, and, again, Hover State's gonna help you with that utilization rate for the day. I want to call out here, sometimes studios do not put accurate capacity in when they're building out their Walla sites or in their classes. You know, they put a really high number. That's gonna impact this. So be true to your capacity as often as possible. Um, it's really gonna help you understand when you're hitting those high utilization rates and really need to add classes to your schedule or, um, if you, again, have if your bar chart looks like this, you probably want to remove some classes off of your schedule because you're you're simply not filling them and probably spending too much on on payroll. Um, again, some of you guys only have one style of class, so this maybe is not going to be quite as applicable. But for those of you that have multiple styles of classes in your business, um, if I wanna go to a group of time, I can look at what classes, um, are performing better. So you can see your average fill rate over a certain period of time. So if I wanted to look at this over the last year, for example, um, this is going to give me a pretty broad range, um, and I can see right away that my burn boot camp interval training is doing best with from an average fill rate perspective. So this is gonna show you, um, all of that. Oops. Scrolled a little too fast. Now if you have classes that have very small capacity, um, you can decide to include those or not because those are obviously gonna look like high utilization rates if they're, like, a a small group maybe you call an appointment or a small group a class in Walla, um, you've got the option to include those or not. We naturally don't include those, but you can if you want to. Um, this next one is going to be revenue focused. So when you look at, um, you know, let's look at maybe September. I think I had quite a bit of visit history in September. Um, I should have said at the beginning, again, this defaults to all locations. You can select your location, but this is where, uh, you're gonna be able to see average revenue, uh, per class for that period of time. So when you're looking at different styles of classes, my booty burn is definitely averaging more revenue than almost anything else on the schedule. So they show up here alphabetically, but you can definitely see what's making you more money, um, and what perhaps needs another look when you're taking a peek at adding classes to the schedule or removing. And then lastly, this is a little bit more granular. This is kind of your top performers versus your, um, classes that maybe need to be removed from the schedule. So this is individual instances, time stamps. So on January 21, we had this awesome advanced touch tone with Britney. So if all of the top performers are, you know, Tuesdays at 1PM with Britney, you know that, you know, maybe that's somebody that you wanna give a little raise to or do something nice for her, make sure she doesn't go anywhere. But more importantly, if you have bottom performers that are consistently the same and are trending over time down, those may be classes that you make some changes to. Maybe it's a style, maybe it's a teacher, uh, maybe it's a time slot, but something needs to change on the schedule. So this is one of those that it's it's kind of a big report. It has a lot of information in it, but our goal here is to give you lots of angles to look at your schedule and make those scheduling decisions. Um, and with that, you can also look at your teacher ranking report. So the teacher ranking report is meant to help you, like in that instance, that last the classes that are maybe your bottom performers or the classes that are generating the smallest amount of revenue. This is where you go next because you can see, is it a teacher problem? And if you see that, um, you know, Alex is consistently at the bottom of the barrel when it comes to average fill rate, average clients, um, you know, maybe reliability and profitability, then you know it probably is an Alex problem, um, or there's training that needs to happen for that individual. But the goal here is to be able to see your teachers compared to each other and who your standouts are, who needs a little support and love and training, and also from a payroll perspective. It doesn't make sense to be losing money on your teachers month over month. Um, I do encourage you to dive into these reports, uh, and, again, if you see the question mark, you're gonna be able to get into how we came up with that, uh, formula for each one of these. Please, please, please look at those. It's gonna be helpful. Um, but when you go into each instructor, you'll be able to get a little bit more granular here. So you can see, um, reliability. You can see how much money they are making you over a period of time or each month. And then, also, this part here is really telling. So, um, if you have a teacher that has a 100 unique clients, but 90% of them are only coming once to their class, it's probably they're just in a banger time slot, and anybody's gonna do well in that. So you might not want your highest paid teacher in that time slot. Slot. Or you might wanna coach this instructor on how they can build relationships with clients a little bit better and send them a personal message after class inviting them back. Alright. I've got a couple quick ones to go through. Um, I'm gonna jump really fast into the KPIs report. For those of you that are multi location, this is gonna be a report where you can compare your studios next to each other. So, again, I really encourage you to click on the I. This is gonna give you on the formula. Um, but when you open these up, we can see I've got five locations. I can see how they're doing. Obviously, my coast location is crushing it. Um, but this is the financial tab, so I can see my recurring versus my total sales. And that's a really helpful metric, especially if you're a business really banking on predictability. Um, I often hear the goal is to have 80% of your revenue be recurring. So this is a nice way to track that and see how each location is doing, um, compared to others. Now we get the question often, what is this number versus this number? Again, it's under the eye, but you can see the first number is the total paid so far. The second is what's expected to be paid. So if you had failed billing, that we were expecting that. And so that it'll be included in this number, but won't be included in there. Or if it hasn't yet been paid, but we're expecting it. So if I were looking at February, for example, this is what we're expecting in February, but nothing's been paid yet. Um, we have a retention column here. So this is gonna be, uh, kind of similar to that plan gain loss report that we looked at at the beginning, but this way you can compare your locations next to each other and see your churn rates and your new your new canceled net. So this is gonna be a really nice place to just see if you've got a problem with retention at one studio versus another. And then, again, intro offers similar to our intro offer report. This is gonna be the best place to compare your locations where you can see your conversion percentage and how many are sold. So especially as you're opening new locations, for those of you that are franchises that are in growth mode, um, this is gonna be really helpful as you're going into, you know, how sustainable the pipeline is at some of those new locations after you get through presales. Alright. Those are my main reports that we are gonna go through today. I do want to let you know that I created a bit of a cheat sheet too for you guys. So if I go back into my webinar, um, or I'm sorry, my, uh, Google Sheet, I created a report for each role in the business, like a a kind of if you've got a head of programming, your operations and your finance folks, your sales, front desk folks that are tracking leads, this is kind of the the cheat sheet of the reports that I would be looking at on a regular basis for each of those kind of buckets within the business. So, um, this is gonna be really helpful. And then we have a couple of things that I think will be nice for you guys that are, uh, just looking for little ways to surprise and delight your clients. And I think this is oh, I didn't share that. I'm so sorry. Um, let me go back. This is the, uh, reports for each role. Sorry about that. Um, the surprise and delight reports that we have in the software, uh, these are just nice ways to touch base with clients at different points in their journey. So one is the left on the wait list report, and I don't have tons of people on my wait list in my demo site. But for those of you that are low capacity, busy studios, you are going to naturally have people that get stuck on your wait list on a regular basis. And especially in January, you guys, when studios are busiest, this is when some of your most frequent members get the most frustrated, and you're really at risk for losing them. So this is a great report to run on maybe a a monthly or a bimonthly basis just to check-in and see, like, if Matthew has been left on a wait list four or five times over the last month, that's somebody that, a, is at risk of canceling because if they're paying a lot for their membership and not getting into classes, it's not worth it. But, b, might just not be feeling very special. So this is somebody I would send a personal note to, I would text them, I would call them, I would invite them or make them your guest in the class. Um, do do something to make sure that they know they they mean a lot to your business. So this is gonna be a really nice report to just give you guys, I don't know, a glimpse into the people that might need a little extra love. Um, another one that we released very recently, you guys, thanks to all of your requests, is our visits by client, uh, report. So for those of you that do challenges and you want to quickly be able to see within a period of time, so, you know, maybe last month, um, you did a December challenge, um, you can see very quickly if you toggle on the total, the people that came multiple times. Maybe you wanna just see the people that hit certain number of visits. Um, you can see it by location over on the side here, but this is gonna be, uh, you know, specific to classes and appointments or just classes or just appointments. The good news is for those of you that have just migrated to WALLA you can include migrated data in this as well. But, um, you know, this is going to be really helpful for those of you that are wanting to just high five students that maybe have taken a certain number of classes, have hit a certain milestone within a specific period of time, um, or just generally have been giving you a lot of business and and you know they're spending a lot of money with you and you want to um, give them some love. So visits by client report, it is under clients, that is a pretty new report so I just wanted to make sure everybody saw that. Alright, the last thing I'm going to do is give you guys a sneak peek into audiences because this is something that kind of works like a report in Wuala, and if you have not added audiences to your dashboard, please do this this week. It is, like, the one degree shift you can make in your business that could make a huge impact. Um, just as a quick reminder, audiences are essentially grouping your clients into a segment based on them meeting certain conditions. So let's say I want everybody in in this audience that I built, for example, um, I wanna see all of my members, my autopay members. So everybody who's an autopay member, raise your hand. Great. Now everybody who hasn't taken a class in the last three weeks, keep your hand up. Everybody else, step back into line. So now I have a group of people who are active paying autopay members who have not been into my studio in three weeks. So I can either create an automation if you're using the marketing suite that reaches out to them. I can have it be a task for one of my front desk staff to go through here, click on each person, and go through and text those folks and just say or email those folks if they don't have a phone number and, um, you know, pop in to encourage them to get back into the studio. So that is a really, really helpful tool, and if you've never built audiences before, I highly encourage you to check out our sales and marketing course. I have a boatload of really helpful audiences with step by step videos on how to build them. It takes two minutes to build most of them, and it's really gonna help you, um, highlight people at those really important parts of their journey. Uh, the audiences feature on the dashboard is unique to everybody who's logged in. So if you are a teacher and you want your teachers to see a list of people who have a first class with them, upcoming booking, you can create a a condition or I'm sorry, an audience, and the condition is anybody who has zero visits with Laura in the past and has an upcoming booking with Laura in the future. And then Laura can go through this list and send them a quick text message. Maybe you create a snippet for them. So if you go to text someone I have a phone number in here. I need need someone with a phone number. Um, if you go to text someone and they've got a phone number, you can use our snippet functionality where you've prewritten just a, you know, first time class with Laura. Hey. Excited to meet you tomorrow. Um, be sure to bring your grippy socks and water. We definitely get our sweat on in my classes. Again, it's another surprise and delight way you can use kind of our reporting functionality or audience functionality in Wuala. Again, the marketing suite course has a huge list of audiences that are really helpful, um, but these are just some examples that you could put onto your dashboard or just generally build to use for that personalized communication with your clients whenever they come in. Alright. Any questions on that? I'm I'm actually not gonna dive into full questions. Oh, thanks, Beth. Beth just shared the the sales and marketing suite course link. Um, I'm not gonna go into full questions on how to build audiences because that could be another whole webinar in and of itself. Okay. Awesome. Last thing, um, let's just go back into the presentation. So the client happiness, we went through these. Get creative with your audiences. You can get really granular in our audiences. So, um, play around with conditions. You can see who lives in each one of those audiences, run them, view the contacts, reach out. Um, again, we will be sharing this recording with everyone who registered. If you are new to Wuala or, um, interested in Wuala, you can absolutely book a full deep dive demo with our team, and we can go into some of these in more detail. Uh, we'll be sending the deck out here so you'll have all of this. But, overall, I just wanna thank you guys for taking time to learn your software a little bit better this morning. Um, it is it's hard to dedicate time to getting better at your business with these granular details, but These are the things that are really going to help move the needle, make your clients happier, and create sustainable systems that make your business profitable. So thank you all, really really appreciate it. It was lovely to have have you, and, uh, the recording will be sent out in the next couple of hours. So keep your eyes out. We've got some exciting webinars coming up in the next month, and we'll see you all soon. Thank you so much.


.png)


.webp)


.webp)

.webp)


%20-%202025-08-06T171547.606.webp)

%20-%202025-08-07T222242.577.webp)
%20-%202025-08-05T211155.122.webp)
%20-%202025-08-05T164322.525.webp)
%20-%202025-07-30T123218.666.webp)
%20-%202025-02-07T095206.530.webp)
%20-%202025-06-24T163406.559.webp)

%20-%202025-06-23T164548.621.webp)
%20-%202025-06-20T081954.590.webp)
%20-%202025-06-18T171359.185.webp)
%20-%202025-06-18T170438.281.webp)
%20-%202025-06-05T133636.454.webp)


%20-%202025-04-29T110753.430.webp)
%20-%202025-04-21T175210.819.webp)
%20-%202025-04-21T143210.386.webp)
%20-%202025-03-31T131609.985.webp)
%20-%202024-07-11T133032.638.webp)
%20-%202025-03-13T132000.152.webp)
%20-%202025-02-24T212907.017.webp)
%20-%202025-02-06T160642.934.webp)
%20-%202025-01-31T134528.551.webp)

%20-%202025-01-21T082443.942.webp)
%20(56).webp)

%20(80).webp)
%20-%202025-01-09T165342.741.webp)

%20(87).webp)
%20-%202024-11-12T131337.086.webp)
%20-%202024-12-30T132528.539.webp)


%20(84).webp)
%20(71).webp)
%20-%202024-11-25T170114.849.webp)


%20(70).webp)


%20-%202024-08-19T140552.131.webp)
%20-%202024-10-10T130747.192.webp)
%20(64).webp)
%20-%202024-08-02T115234.467.webp)
.webp)

%20-%202024-06-21T140425.892.webp)

%20-%202024-05-31T101839.392.webp)
%20-%202024-05-23T180341.929.webp)